Safari 3.1 Part 2 – The Develop Menu/Web Inspector
This is hands down the issue that will covert me to using Safari. I live and die by Firebug at work. It has so many applications, the most amazing of which is the ability to edit styles and see live updates without switching between programs. Plus you get to see all your CSS properties right next to each other, so if you over somehow over-ruling a style you can see how best to go about fixing your problem. Plus you got the DOM right there to help your JavaScript.
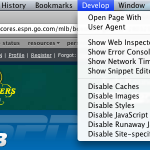
So now this feature comes built in. Here’s how to enable the Safari develop menu.
It works pretty similar to how Firebug does, however, there is some additional coolness/drawbacks.
What’s the same
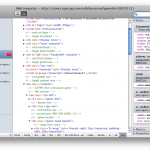
It starts as a menu item, but of you hit option + command + i, you get a pop-up version of the Web Inspector (of you can go to the Develop menu and select Show Web Inspector). Firebug begins in the same window as the page you are, but you can open it in a separate window after that. Starting in a separate window is nice because you can see the whole page without any obstruction, but you can always click the bottom right hand corner to open the Inspector in the same window. I should point out that there is no button to close the Inspector once it is in the same window was the page, which totally blows (and even the option + command + i shortcut doesn’t close it).
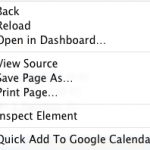
Another great feature is the “Inspect Element” option. If you right click on element, you will see it at the bottom of the option menu. This is another feature borrowed from Firebug.
They both have features that let you get into the DOM, they just have different titles. In Firebug, its called “DOM”. In Web Inspector, DOM properties are found under “Properties”. I think this is Apple’s subtle way of merging the way people thing about HTML and JavaScript (as two separate languages) into one unified structure. While they both do separate things and operate as separate languages, there really isn’t much difference when it comes to the end user. Plus one (JavaScript) is generally useless with out the other (HTML).
What’s Different
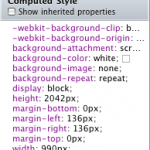
When it comes to styles, you get sort of the same treatment, you can see all the styles for a given element, as they broken down by CSS properties. Web Inspector gives you a nice feature by listing all the applied styles first, regardless of where the property is coming from, and then it lists them by selector. However, you cannot edit this “Computed Style”; you have to scroll down some more and find the real style.
Another main difference between Firebug and the Web Inspector is when an element is highlighted (or inspected). Firebug has a color coded system, so you can see the element size (in blue), the padding (in purple), the border (in grey), and the margin (in yellow).
Web Inspector grays out the screen, except for the element, so you can really focus in on it. But you are missing the box model elements, which can come in handy.
Layout vs. Metrics
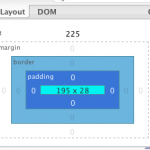
They both a way of breaking down the box model in useful terms, but I still like the Firebug implementation. Firebug has what it calls “Layout” which shows all the measurement applied by the box model (including offset), and when you mouse over one of them, overlays a ruler for the X and Y on your site and shows you where your boundaries lie within that. This can be great for aligning elements, and helping improve typography.
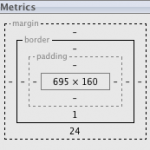
Web Inspector has what it calls “Metrics”, but it stops there. It does show you all the measurements of the block but it lacks to in browser display you get with Firebug.
General look and feel
Firebug goes for a tabbed layout, so everything works similar to how your browse. Web Inspector goes in a different direction and breaks each file down by type, and allows you to access them in this way.
It basically reinforces the Aqua branding of Safari and borrows lots of its style from other Aqua interfaces. I kinda like this because Apple has a great approach to Usability. It does reinforce to the user that all of these styles come from different files, but in the end get put together by the browser. Firebug breaks everything down by type, but doesn’t necessarily draw the distinction (at least not directly) of where all this info is coming from.
Browser Defaults
This is a key component, especially for people who are learning, and it is found only in Web Inspector, and that is browser defaults. Web Inspector gives the user the ability to enable “Show Inherited Properties” which shows the user the browser defaults for each element. For a web developer this is crucial. I think the IE7 developer tools attempts this, but still doesn’t let you know about the 2 pixels of hidden border (I highly recommend “border-collapse:collapse;” make it into every stylesheet you create).
This does let you know about how Safari interprets everything, which I like because there are a few things that Safari interprets a little differently than I am used to. Standards compliance is a scary thing. Because it means you will actually get what you want.
Conclusion
Overall, I haven’t had a ton of experience with the Web Inspector yet, but I do like where it is going. Soon it will be on par with Firebug, and maybe surpass it. But until then Firebug is awesome, and I’m loving that browsers are adding built-in development tools, for lazy developer trolls like myself.
Next up, Part 3, Why Apple pissed me off with 3.1…
